like-web-analytics

See how it works

Now we are going to see how live data can be requested from the one-minute-server and analyzed.

Get this thing started

like-web-analytics
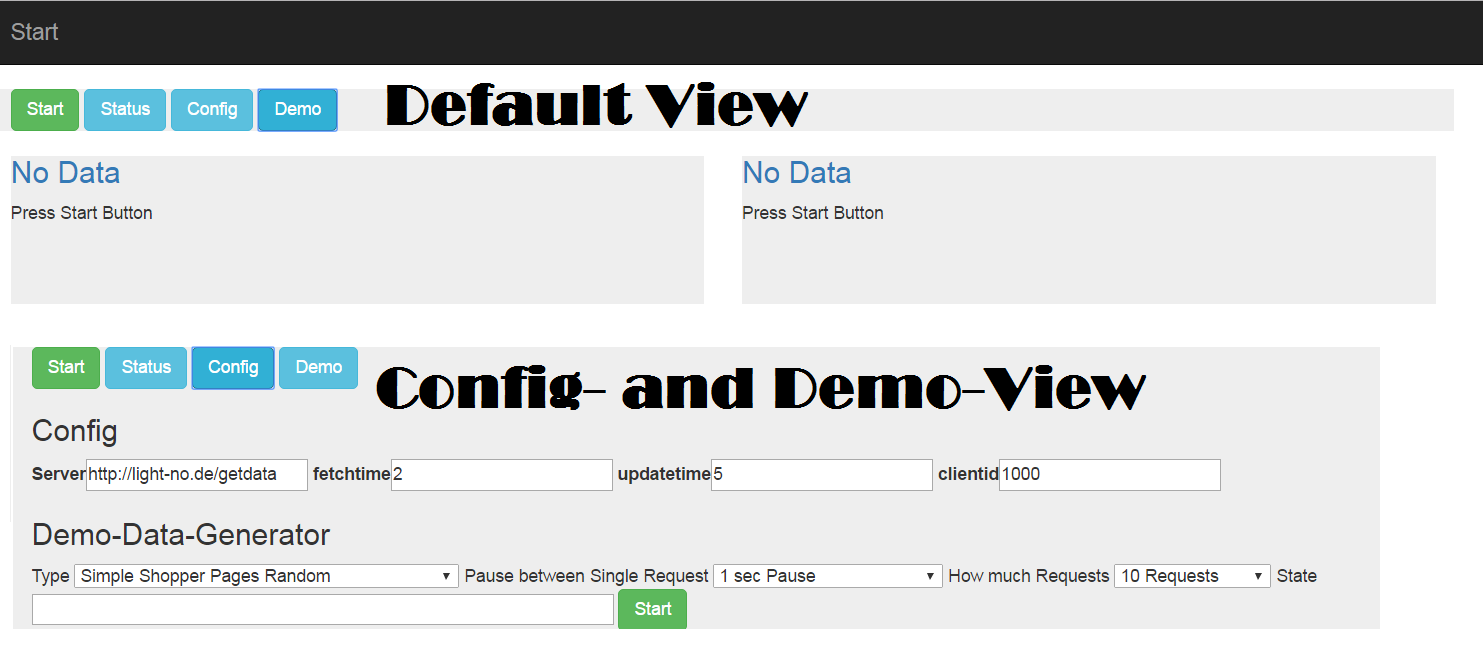
Here you see the default view with no data available.
To request data from the server you have to push the start-button. Press it now.
It makes sense to have differnt times, because request time should not be over 60 seconds, but display time you can have 2 minutes, if its ok for your application.
In the config-view you can set the sever (here my demo-appliance) and how often the data should be requested and the data sould be updated in the view.
In the demo-panel you can choose different things

  • There are differnt labels a user can go to in this demo-shop

    1
    2
    3
    4
    5
    6
    7
    var labels = [
    {"category" : "Startseite", "content" : "Start", "campaign" : "Google1"},
    {"category" : "Startseite/Auto & Motorrad/KFZ-Ersatzteile/Scheibenreinigung/Scheibenwischer", "content" : "Überblick" },
    {"category" : "Startseite/Auto & Motorrad/KFZ-Ersatzteile", "content" : "Kategorie Überblick" },
    {"category" : "Startseite/Elektronik & Computer/Unterhaltungselektronik/Foto & Video","content" : "Kategorie Überblick" },
    {"category" : "Startseite/Elektronik & Computer/Unterhaltungselektronik/TV, Audio & Video/Fernseher & ZubehörFernseher", "content" : "Telefunken Full HD LED TV 102cm"},
    ....
  • Type of shopper :
    … a person visiting random pages from the list
    … a person visiting the pages in the the natural order
    … 10 persons visiting random pages
    … 100 persons visiting random pages

  • Pause between request 1/8 second, 1/4 second,.. till random 5-20 Seconds

  • How much requests are send (5,10,..10000 )

  • and a request down-counter

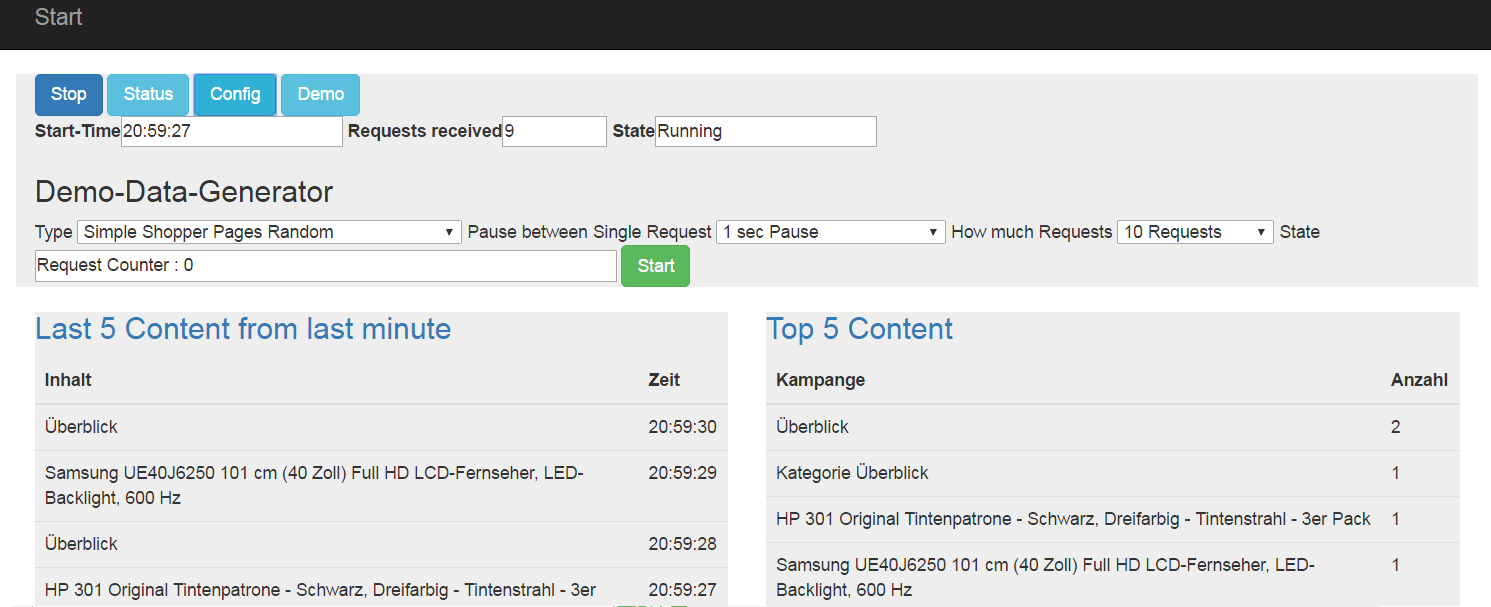
You have got to press start to send requests. Press it now.

A few moments later, denpending on your settings, you see this:
like-web-analytics 2

It you let this run for a while, you will see the requests disapear from the last minute.
On the right side you see the top 5 content requests since the app loaded. They will not dissapear after a minute. They stay till you close the browser, or hit F5.

The Code in analytics.js

After hitting the start-button, the function “start” is called

1
2
3
4
5
6
7
8
9
10
11
function start(){
dataworld.timer1 = window.setInterval(fetchData, document.getElementById("fetchtime").value *1000);
dataworld.timer2 = window.setInterval(displayData, document.getElementById("updatetime").value *1000);
dataworld.serverurl = document.getElementById("server").value;
dataworld.clientid = document.getElementById("clientid").value;
dataworld.lastfetchtime=0;
dataworld.databaseexist=false;
dataworld.numericfields=["day","month","year","hour","minute","second","timestamp","deletetime"];
dataworld.currentpage=1;
dataworld.databasecolumns=[];
...

Which sets a fetch-timer and a display-timer
The function fetchData gets data from the server and call processData()

1
2
3
4
5
6
7
8
9
10
11
12
13
14
15
16
17
function fetchData(){
var dparam = {};
dparam.clientid= dataworld.clientid;
dparam.lastfetchtime = dataworld.lastfetchtime;
dparam.clienttime = new Date().getTime();
$.ajax({
type: "GET",
crossDomain: true,
url: dataworld.serverurl + "?l="+ b64EncodeUnicode(JSON.stringify(dparam)),
dataType: "text",
success: function(data) {
if(data.length > 0){
statusmessage("Recieved Chars " + data.length);
processData(data);
}
...

In this function the data are splitted into lines and parsed. Neccessary values like time-values are added.
If there are new columns, they are added to the database. Database will be created if it doesnt exist.
The column names are dynamic and must be the same on the sending client and the sql here.

1
2
3
4
5
6
7
8
9
10
11
12
13
14
15
16
17
18
19
20
21
22
23
24
25
26
27
28
29
30
31
32
33
34
35
36
37
38
39
40
41
42
43
44
45
46
47
48
49
50
function processData(data){
//console.log(data)
datalines=[]
datalines = data.split("|||");
if(datalines.length==0){return}
dataworld.currentlines+=datalines.length;
$("#reqreceived").val( dataworld.currentlines);
//statusmessage("Recieved lines: " +datalines.length);
for(lc in datalines){
if(datalines[lc].length==0){break;}
//console.log(datalines[lc]);
var parseddata = JSON.parse(datalines[lc]);
var datum = new Date(parseddata.trackingtime);
parseddata.year = datum.getFullYear();
parseddata.month= datum.getMonth();
parseddata.day = datum.getUTCDate();
parseddata.hour= datum.getHours();
parseddata.minute= datum.getMinutes();
parseddata.second = datum.getSeconds();
parseddata.datum = twoDigits(parseddata.hour) + ":" + twoDigits(parseddata.minute) + ":" + twoDigits(parseddata.second );
if(dataworld.databaseexist== false){
createDatabase(parseddata);
dataworld.databaseexist= true;
}
if(parseddata.timestamp > dataworld.lastfetchtime){
dataworld.lastfetchtime = parseddata.timestamp;
}
var inssql = "insert into rawdata (" ;
var colstring="";
checkDatabaseColumns(parseddata);
for(ind in parseddata){
var k = colstring.length=="" ? "" : ",";
colstring+= k+" " + ind;
}
inssql += colstring + ") values (";
colstring="";
for(ind in parseddata){
var k = colstring.length=="" ? "" : ",";
if(dataworld.numericfields.includes(ind)){
colstring+= k +" " + parseddata[ind]+"";
}else{
colstring+= k+ "'" + parseddata[ind]+"'" ;
}
}
inssql+=colstring + ")";
alasql.exec(inssql);
}
}


Display results

I choosed a simple design (6 displays per page, 2 in a line. id of every element: 1 to 6)
For every analyze you have got a sql, a display type and some html/css-properties
Get all entries for the current page; execute the sql, put the values in a converter, display it on the right id, ready !

1
2
3
4
5
6
7
8
9
10
11
12
13
14
15
16
17
18
19
20
21
22
23
24
25
26
27
28
29
30
31
32
33
34
35
36
37
38
39
40
41
42
43
44
45
46
47
48
49
50
51
52
53
54
55
56
57
58
59
60
61
62
function displayData(){
//console.log("display");
var analyseLayout=[
{ "title" : "Last 5 Content from last minute",
"page" : 1,
"into" :"1",
"sql" : "Select top 5 content, datum from rawdata where trackingtime > "+ (new Date().getTime()-60000) + " order by 2 desc",
"display" : "simpletable",
"heading" : ['Inhalt','Zeit'],
"dclass" : ".col-md-4"
},
{ "title" : "Top 5 Content ",
"page" : 1,
"into" : "2",
"sql" : "Select top 5 content, count(*) from rawdata group by content order by 2 desc",
"display" : "simpletable",
"heading" : ['Kampange','Anzahl'],
"dclass" : ".col-md-4"
},
{ "title" : "Anzahl User",
"page" : 1,
"into" : "3",
"sql" : "select count(*) from (Select distinct user from rawdata )",
"display" : "simpletable",
"heading" : ['Benutzer'],
"dclass" : ".col-md-4"
}
];
for(var n = 1;n <= 6; n++ ) {
$("#loc"+ n ).html("<h3><a href='#'></a></h3>");
}
for(index in analyseLayout){
var ana = analyseLayout[index];
if(ana.page==dataworld.currentpage){
var localresult="<h3><a href='#'>" +ana.title+ "</a></h3>";
var datas =[];
try {
datas = alasql.exec(ana.sql);
localresult+= converters[ana.display](datas,ana.heading);
$("#loc"+ ana.into ).html(localresult);
} catch(e){
console.log(e);
}
}
}
}
var converters=[];
converters["simpletable"]=function(data,head){
var ret = "<table class='table '> <thead><tr>";
for(var ix in head){ret+="<th scope='row'>"+head[ix] + "</th>"}
ret+=" </tr></thead>"
for(var index in data){
ret += "<tr>";
for(var na in data[index]){
ret += "<td>" + data[index][na] + "</td>"
}
ret += "</tr>";
}
return ret+"</table>";
}

The converter just puts the values into a html-table and returns the result string.See it all at : http://light-no.de/apps/like-web-analyze

See it all at :
See it in live action